⨺ Delaunay dreams: t-shirt inspired p5.js adventure
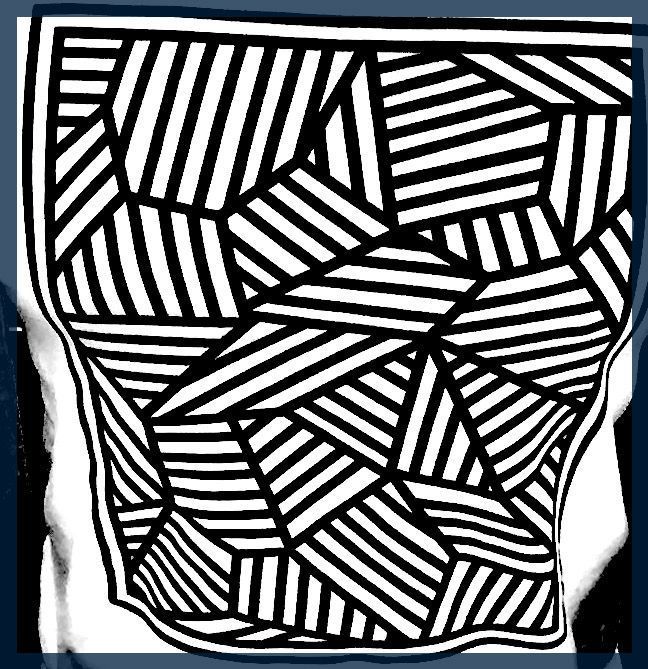
Ever since February 17th, 2020, I've been on a quest to implement a p5.js sketch to replicate the pattern on my t-shirt. Since I got interested in generative art, I got fascinated by the way that the diagonal lines create a dynamic and visually appealing effect.
I wanted to see if I could recreate this pattern using code, and to learn more about the underlying algorithm(s).
In my mind, there were two problems that I had to solve. First, I needed to figure out how to create the cells in a square canvas then fill the cells with varying diagonals.
My initial thought was to divide the edges of the inner frame into equally spaced points. Then, starting from a random point along this edge (call this A), find another random point within the inner square B, and connect this back to a point adjacent to A. Then, A would have been removed from the list of "active points".
Running this algorithm on paper, I realised it would create a few triangles and not necessarily pack the canvas with it. There was something I was missing. For some reason I had a hunch that "creating random triangles" was a solved problem and after some research I found about Delaunay triangulation.
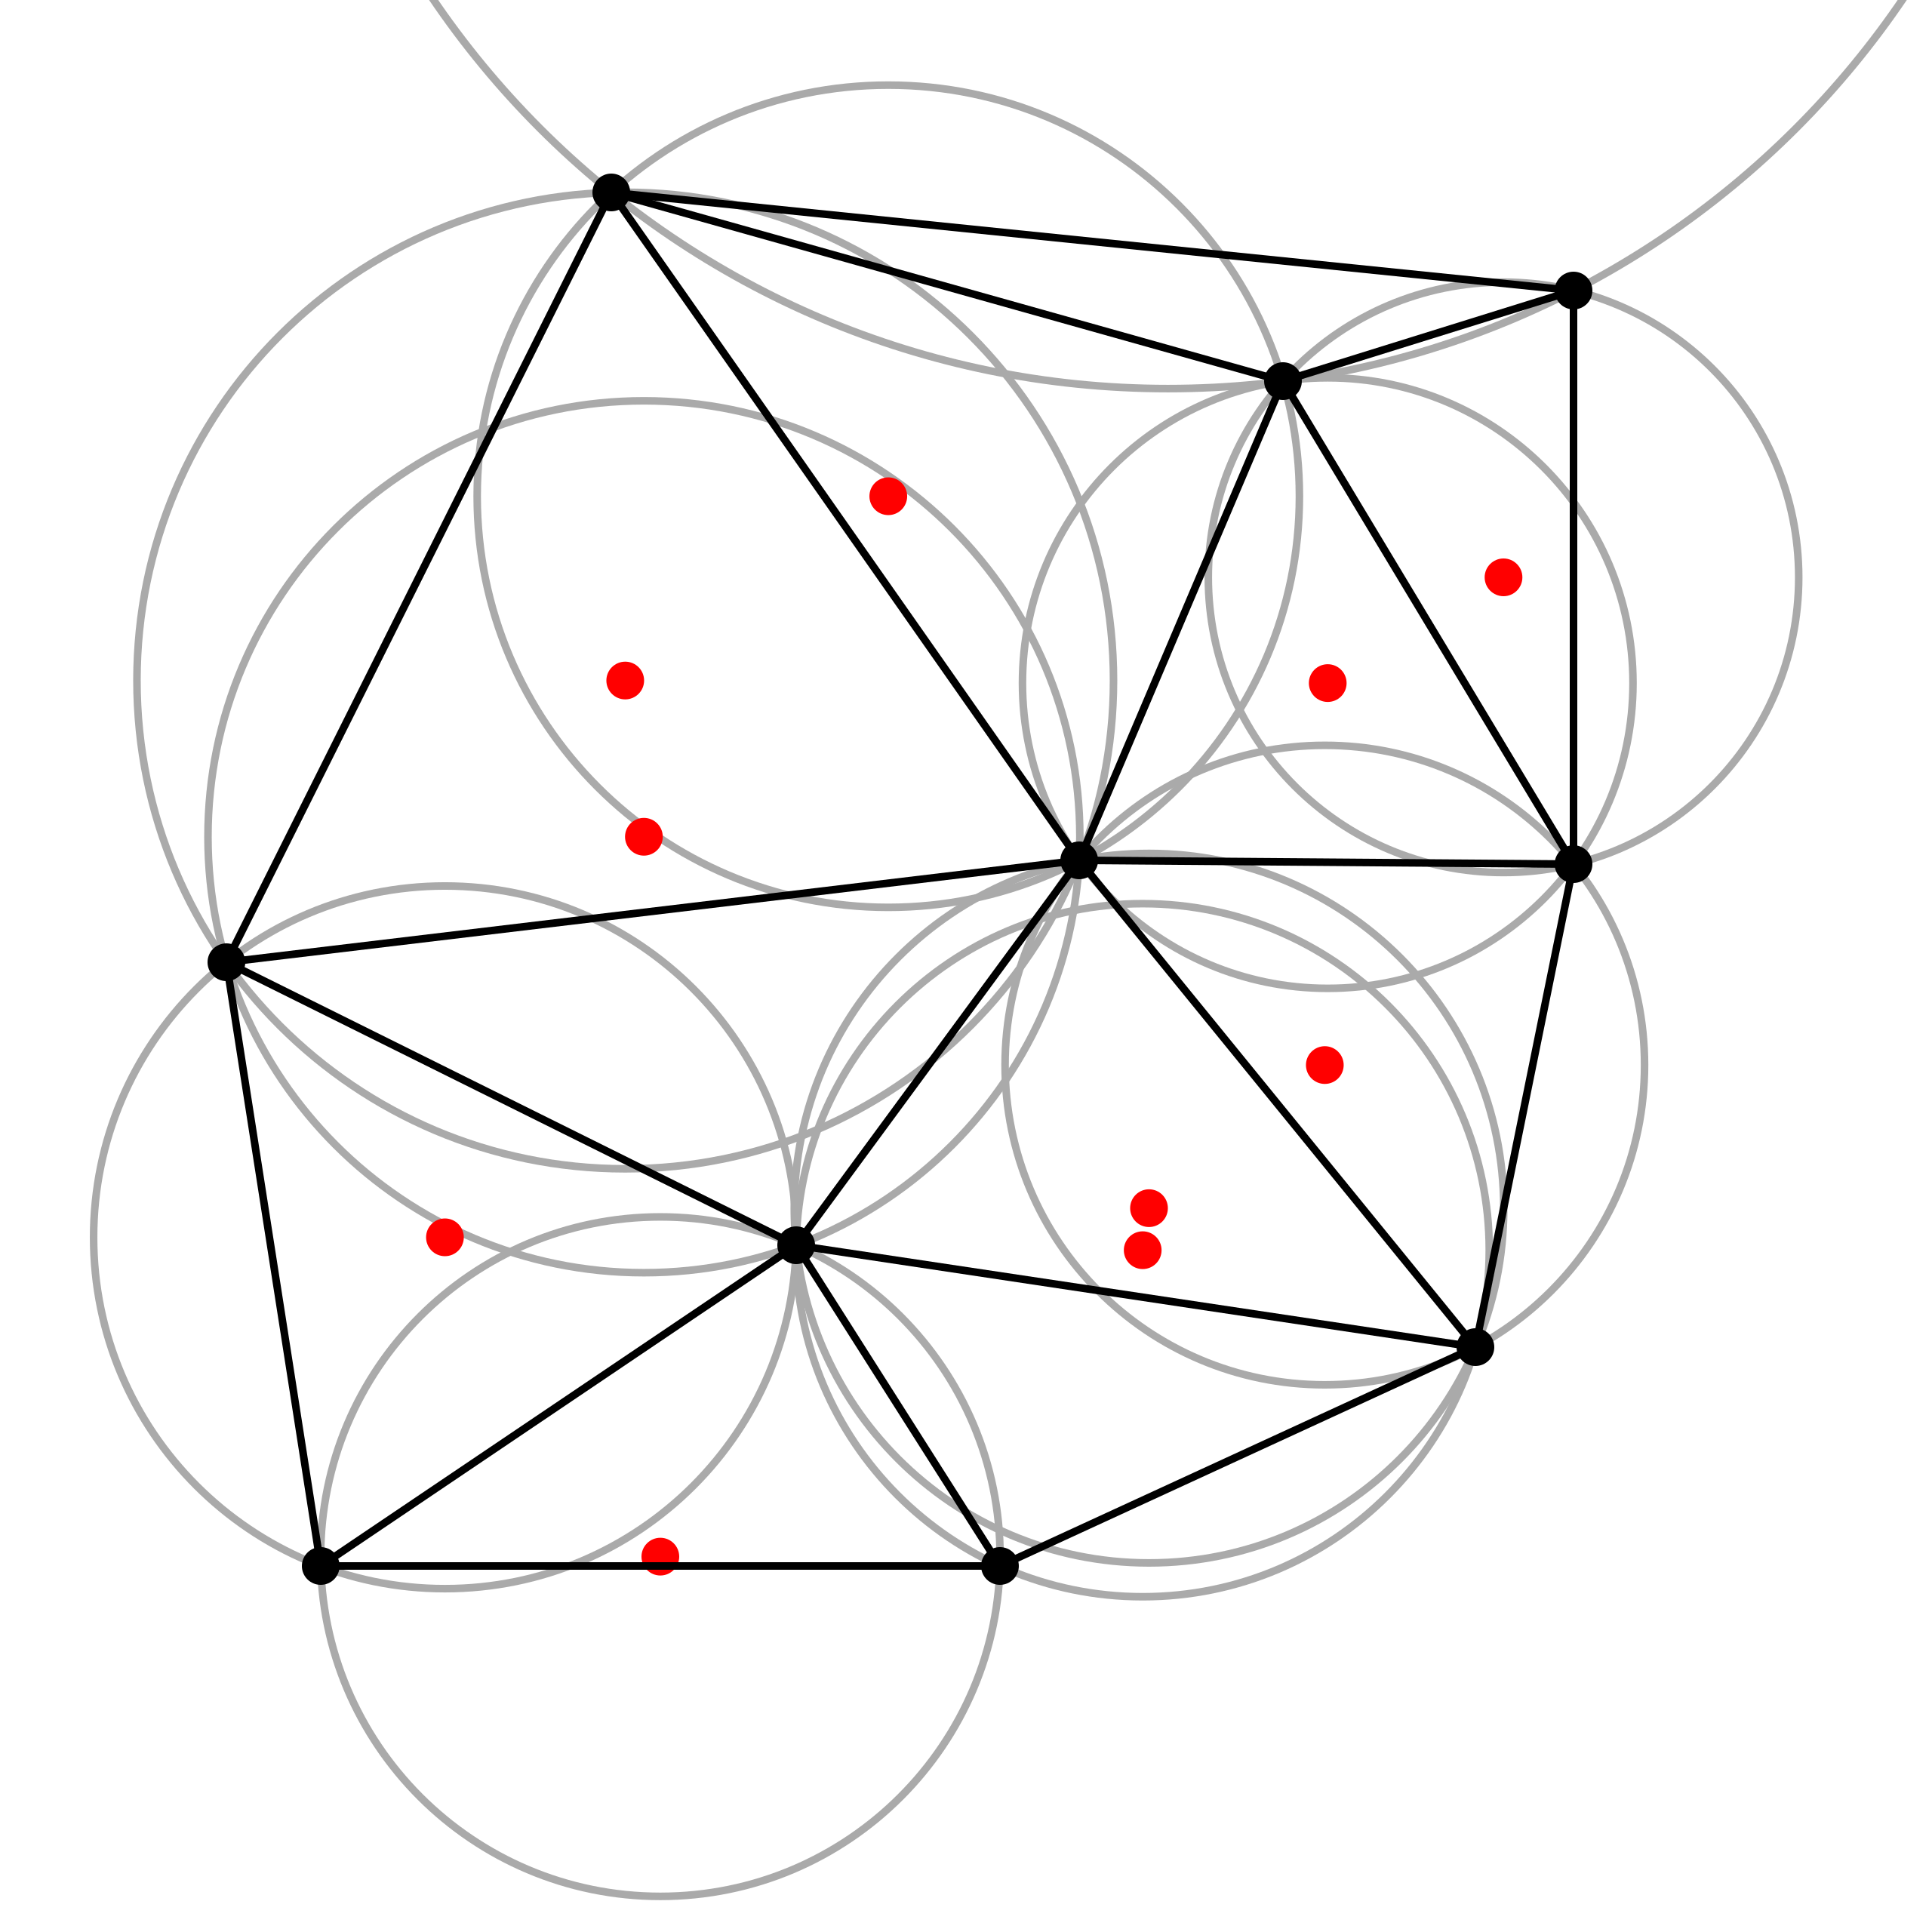
Given a set of points, Delaunay triangulation helps you draw triangles between these points that follow these rules;
- No point is inside the circle that goes through the three corners of any triangle.
- You use as few triangles as possible.
In simple terms, Delaunay triangulation is a way to create triangles from a given set of points while making sure that no point is in the center of the circle, that passes through all three points of the traingle.
With this knowledge in mind I was to find this library


With this library I was able to solve the first part by creating random points within a square, ensuring that the corner points of this square was added and then passing these to the delaunay-triangulate library which returns an array of triangles vertices.
Afterwards, I moved onto drawing the lines within each triangle. My first few ideas was drawing horizontal and vertical lines from the longest side of the triangle to the shortest side. Using the area of each cell as value to then map into the amount of lines to draw.
I spent quite a few hours watching videos on trigonometry to re-remember how to calculate area of triangle and how to finding angles within to then classify a cell as a "skinny triangle".
Unfortunately my ideas at that time never worked in replicating the design I on the t-shirt. You can see a live example below
The code is available here
 bulkan
Yet again, I was missing something that I couldn't quite put my finger on.
👶 Fast forward to September 2023
During the second half of my parental leave, I was finding time in between our baby's naps and I was getting bored with Fifa 23. This is when I started watching videos on Flow Fields, Particles and how to implement them using p5.js.
At the same time I had started solving some LeetCode problems (I was bored 🤷♂️) but that got boring after a while.


With the flow fields I had idea of updating this implementation of Mira-Gumowski fractal that I had created to use flow fields but that idea is a different topic for another day.
As I was going through my notes on generative sketch ideas to see if there was something else I can work on, I ended up reading my notes on replicating the design on this t-shirt.
It was a problem that I wanted to solve. I also noticed that, not each cell was a triangle rather a polygon !
In my initial explanation of Delaunay triangulation I intentionally omitted the relationship to Voronoi diagrams, which I was aware when I had initially come across Delaunay triangulation.
With that in mind I found the following d3 implementation that also had a way of creating a Voronoi diagram.
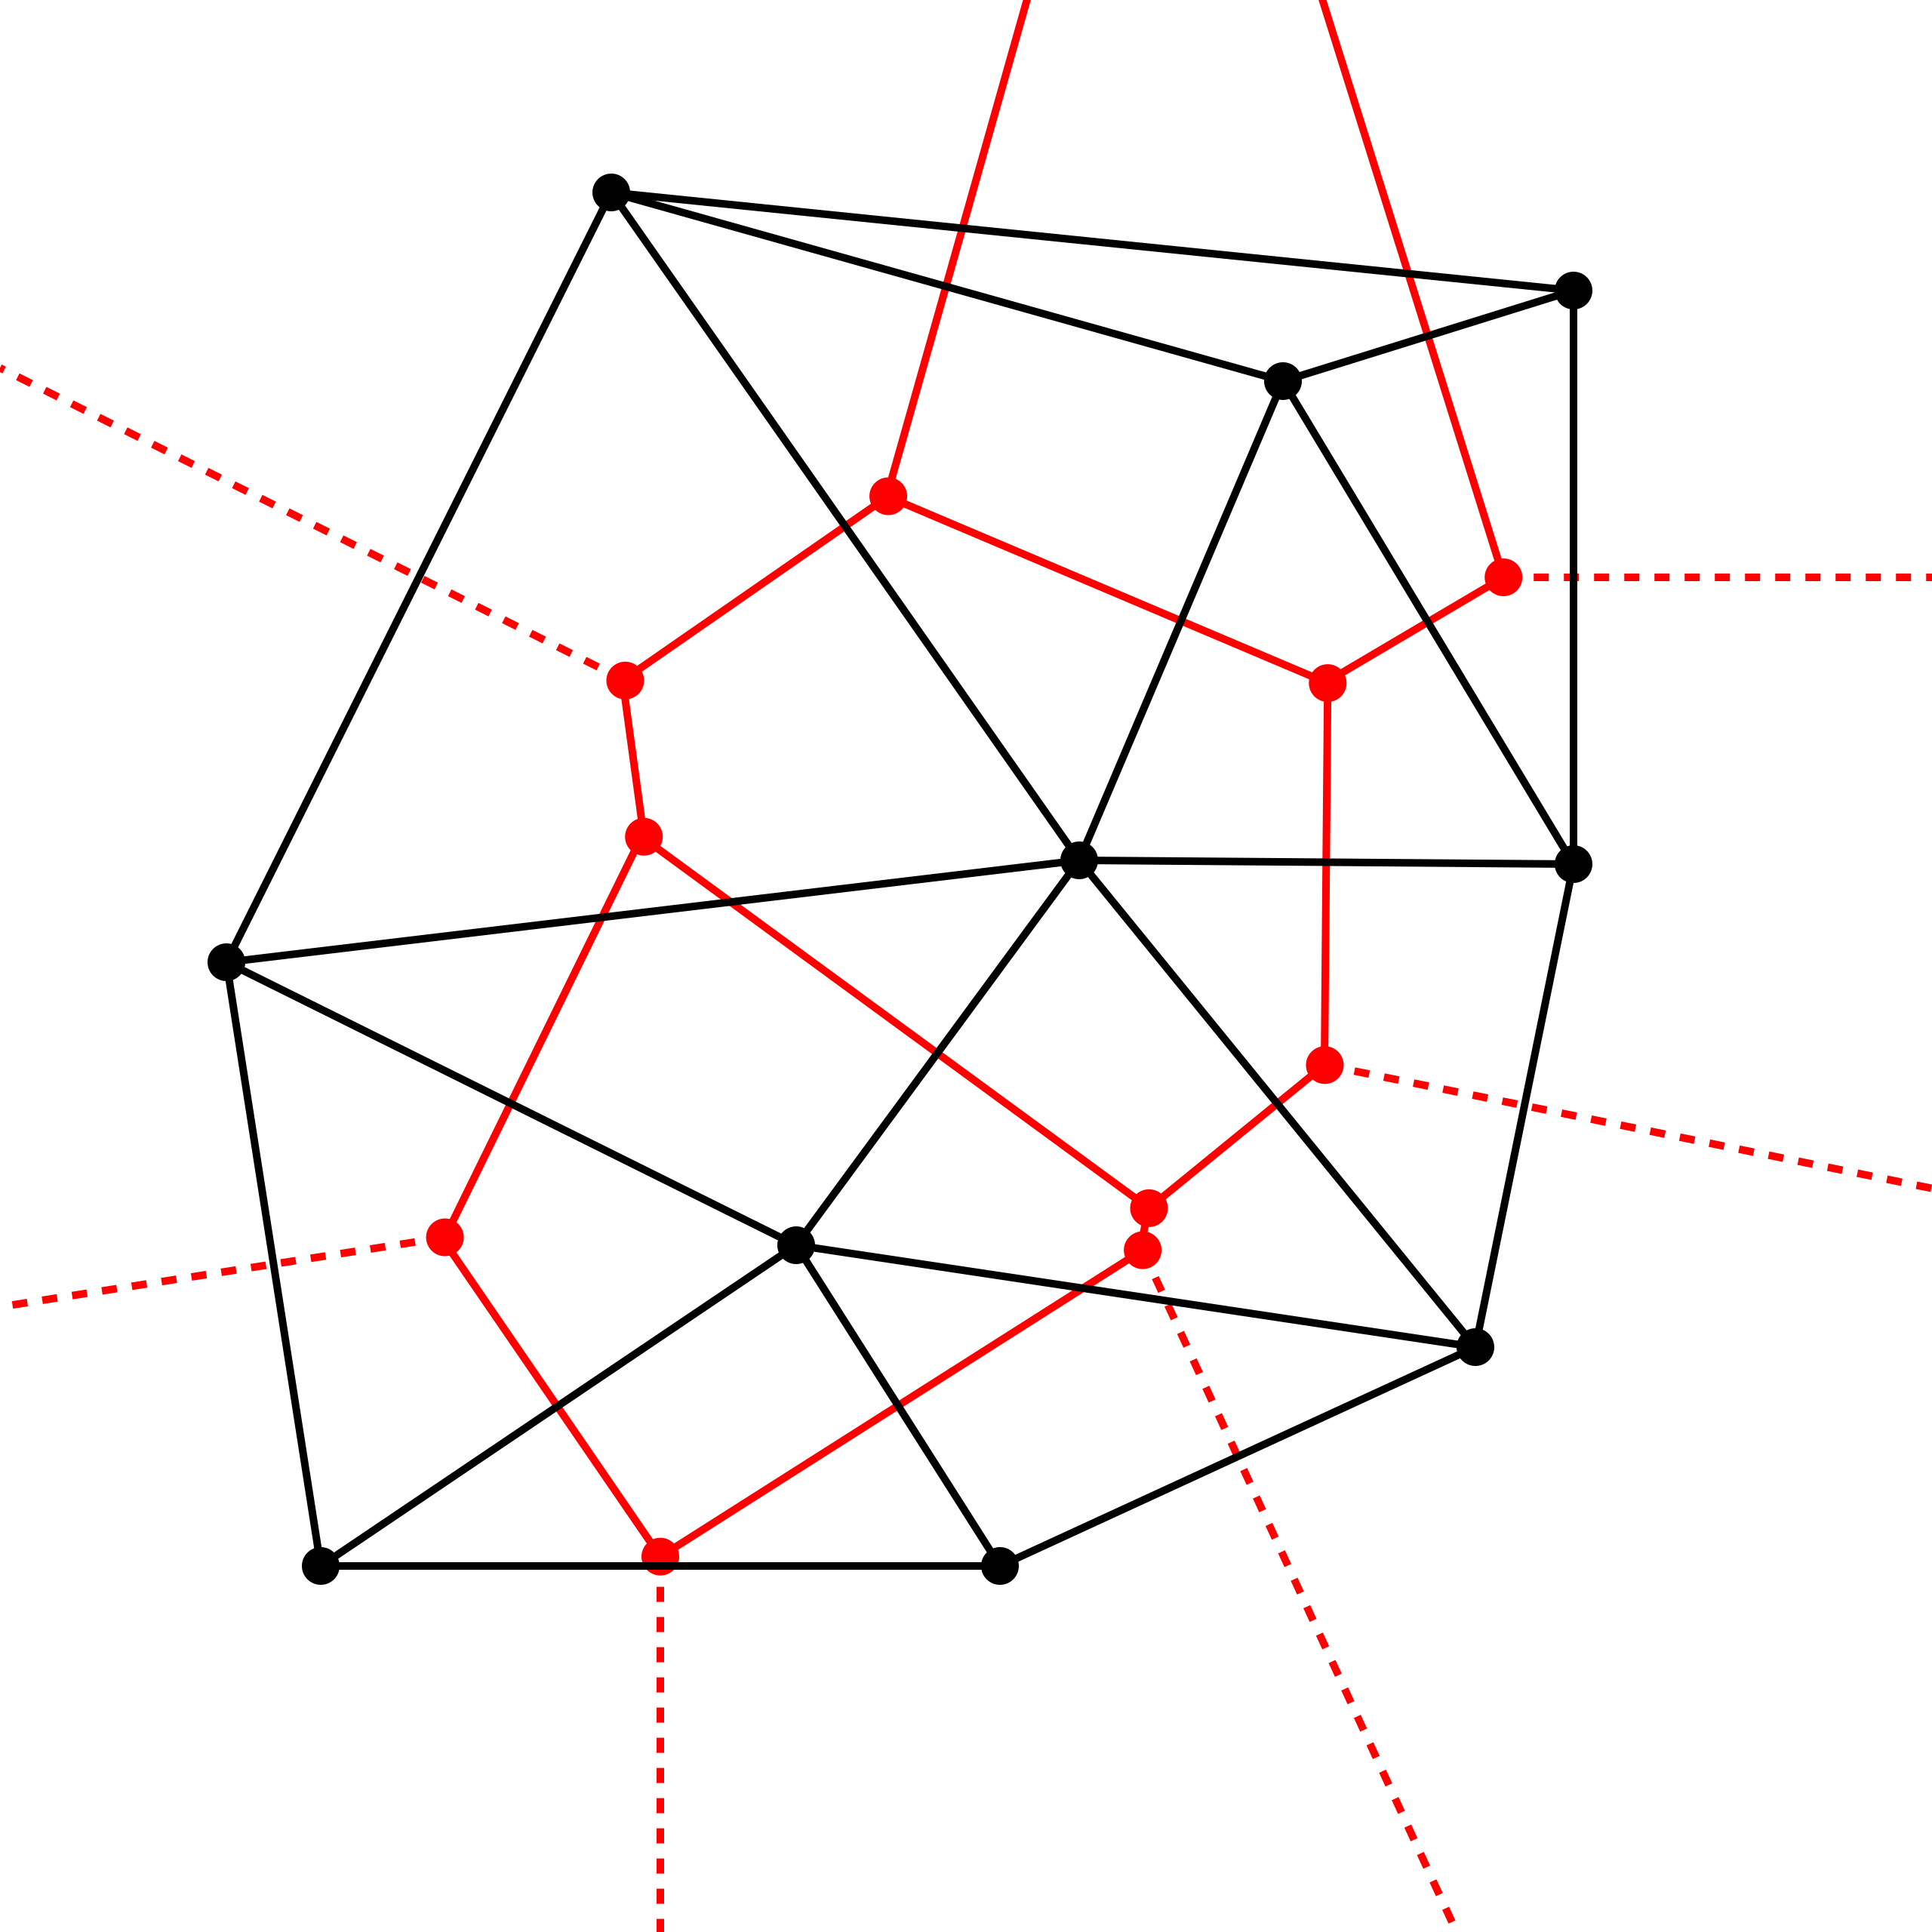
d3Here is a an example Voronoi diagram.

A Voronoi diagram can be created by having random points, then dividing these points into polygons, one polygon for each point that is nearest to the centre of this cell compared to any other point.
A Voronoi diagram can be generated after a Delaunay triangulation is done as the centre point of the circles that passes through all three points (vertices) of the triangle form the edges of the Voronoi diagram.
The diagrams on Wikipedia illustrate this much better than I can articulate
Coming back to the t-shirt design, as I've mentioned the cells aren't just triangle but polygons and Voronoi diagrams was what I should've used instead of triangles.
After a three year hiatus I restarted this project again using d3-delaunay. Creating a Voronoi diagram and using it with p5.js is simple, here is an example using the p5.js editor which you might need to open in a new tab.
In the above example, all that is happening is;
- Creating an array of random points within the
widthandheightof the canvas plus some arbitraryMARGIN - Using Delaunay triangulation for these vertices
- Then creating a Voronoi diagram from the triangulation with a specific
bounds.
Next step was to fill in the lines within each cell. I initially tried drawing equally spaced lines from the longest edge to shortest edge but that ended up drawing horizontal lines.
I was stuck yet again. I started researching when I by chance came across something called the Scan Line Algorithm.
It is an algorithm that is used in (low-level) graphics programming to fill in triangles and polygons, by finding lines that intersect with the polygon. Once you find a line that intersects, you have access to all pixel co-ordinates to be able to fill it.
Here are two videos that helped me a lot in understanding.
Polygon filling
- Start by casting an imaginary line from the minimum
yposition of the polygons vertices to its maximumyposition - Check if this line intersects with any of the edges of the polygon
- If they do, add the
(x, y)coordinates of the intersection points to a list
Using this I was able to fill the cells with lines.
But they all ended up being horizontal lines and I can't believe I didn't notice this before hand 🤦♂️.
I was close ! All I had to was just find the intersection points with the polygon using a diagonal line instead of a horizontal line.
I spent hours trying to get the maths right but something wasn't clicking and still hasn't. If my wife who, is a graphic designer hadn't said that I should just draw the lines in another layer and layer it into the polygons, I would've parked this yet again.
Instead, I remembered the existence of the p5.Graphics class which allows you to create a new offscreen graphics buffer. I wasn't certain at this stage if it supported masking and clipping which I looked up and found the following video.
p5.js clipping masks
It shows how to draw a polygon into a Graphics buffer, then use that shape as a clipping mask to an image. Using this as an example I was able to update my sketch and draw the Voronoi cells into a seperate graphics buffer that then was copied into the main canvas.
Next I used a seperate graphics buffer with the same width and height of the polygon buffer to draw lines starting from x=0 until width * 2 this ensures that there are enough lines even after rotating it.
Then all I had to was use the copy the lines from this new graphics instance into the graphics instance with the polygon and then clip polygon.
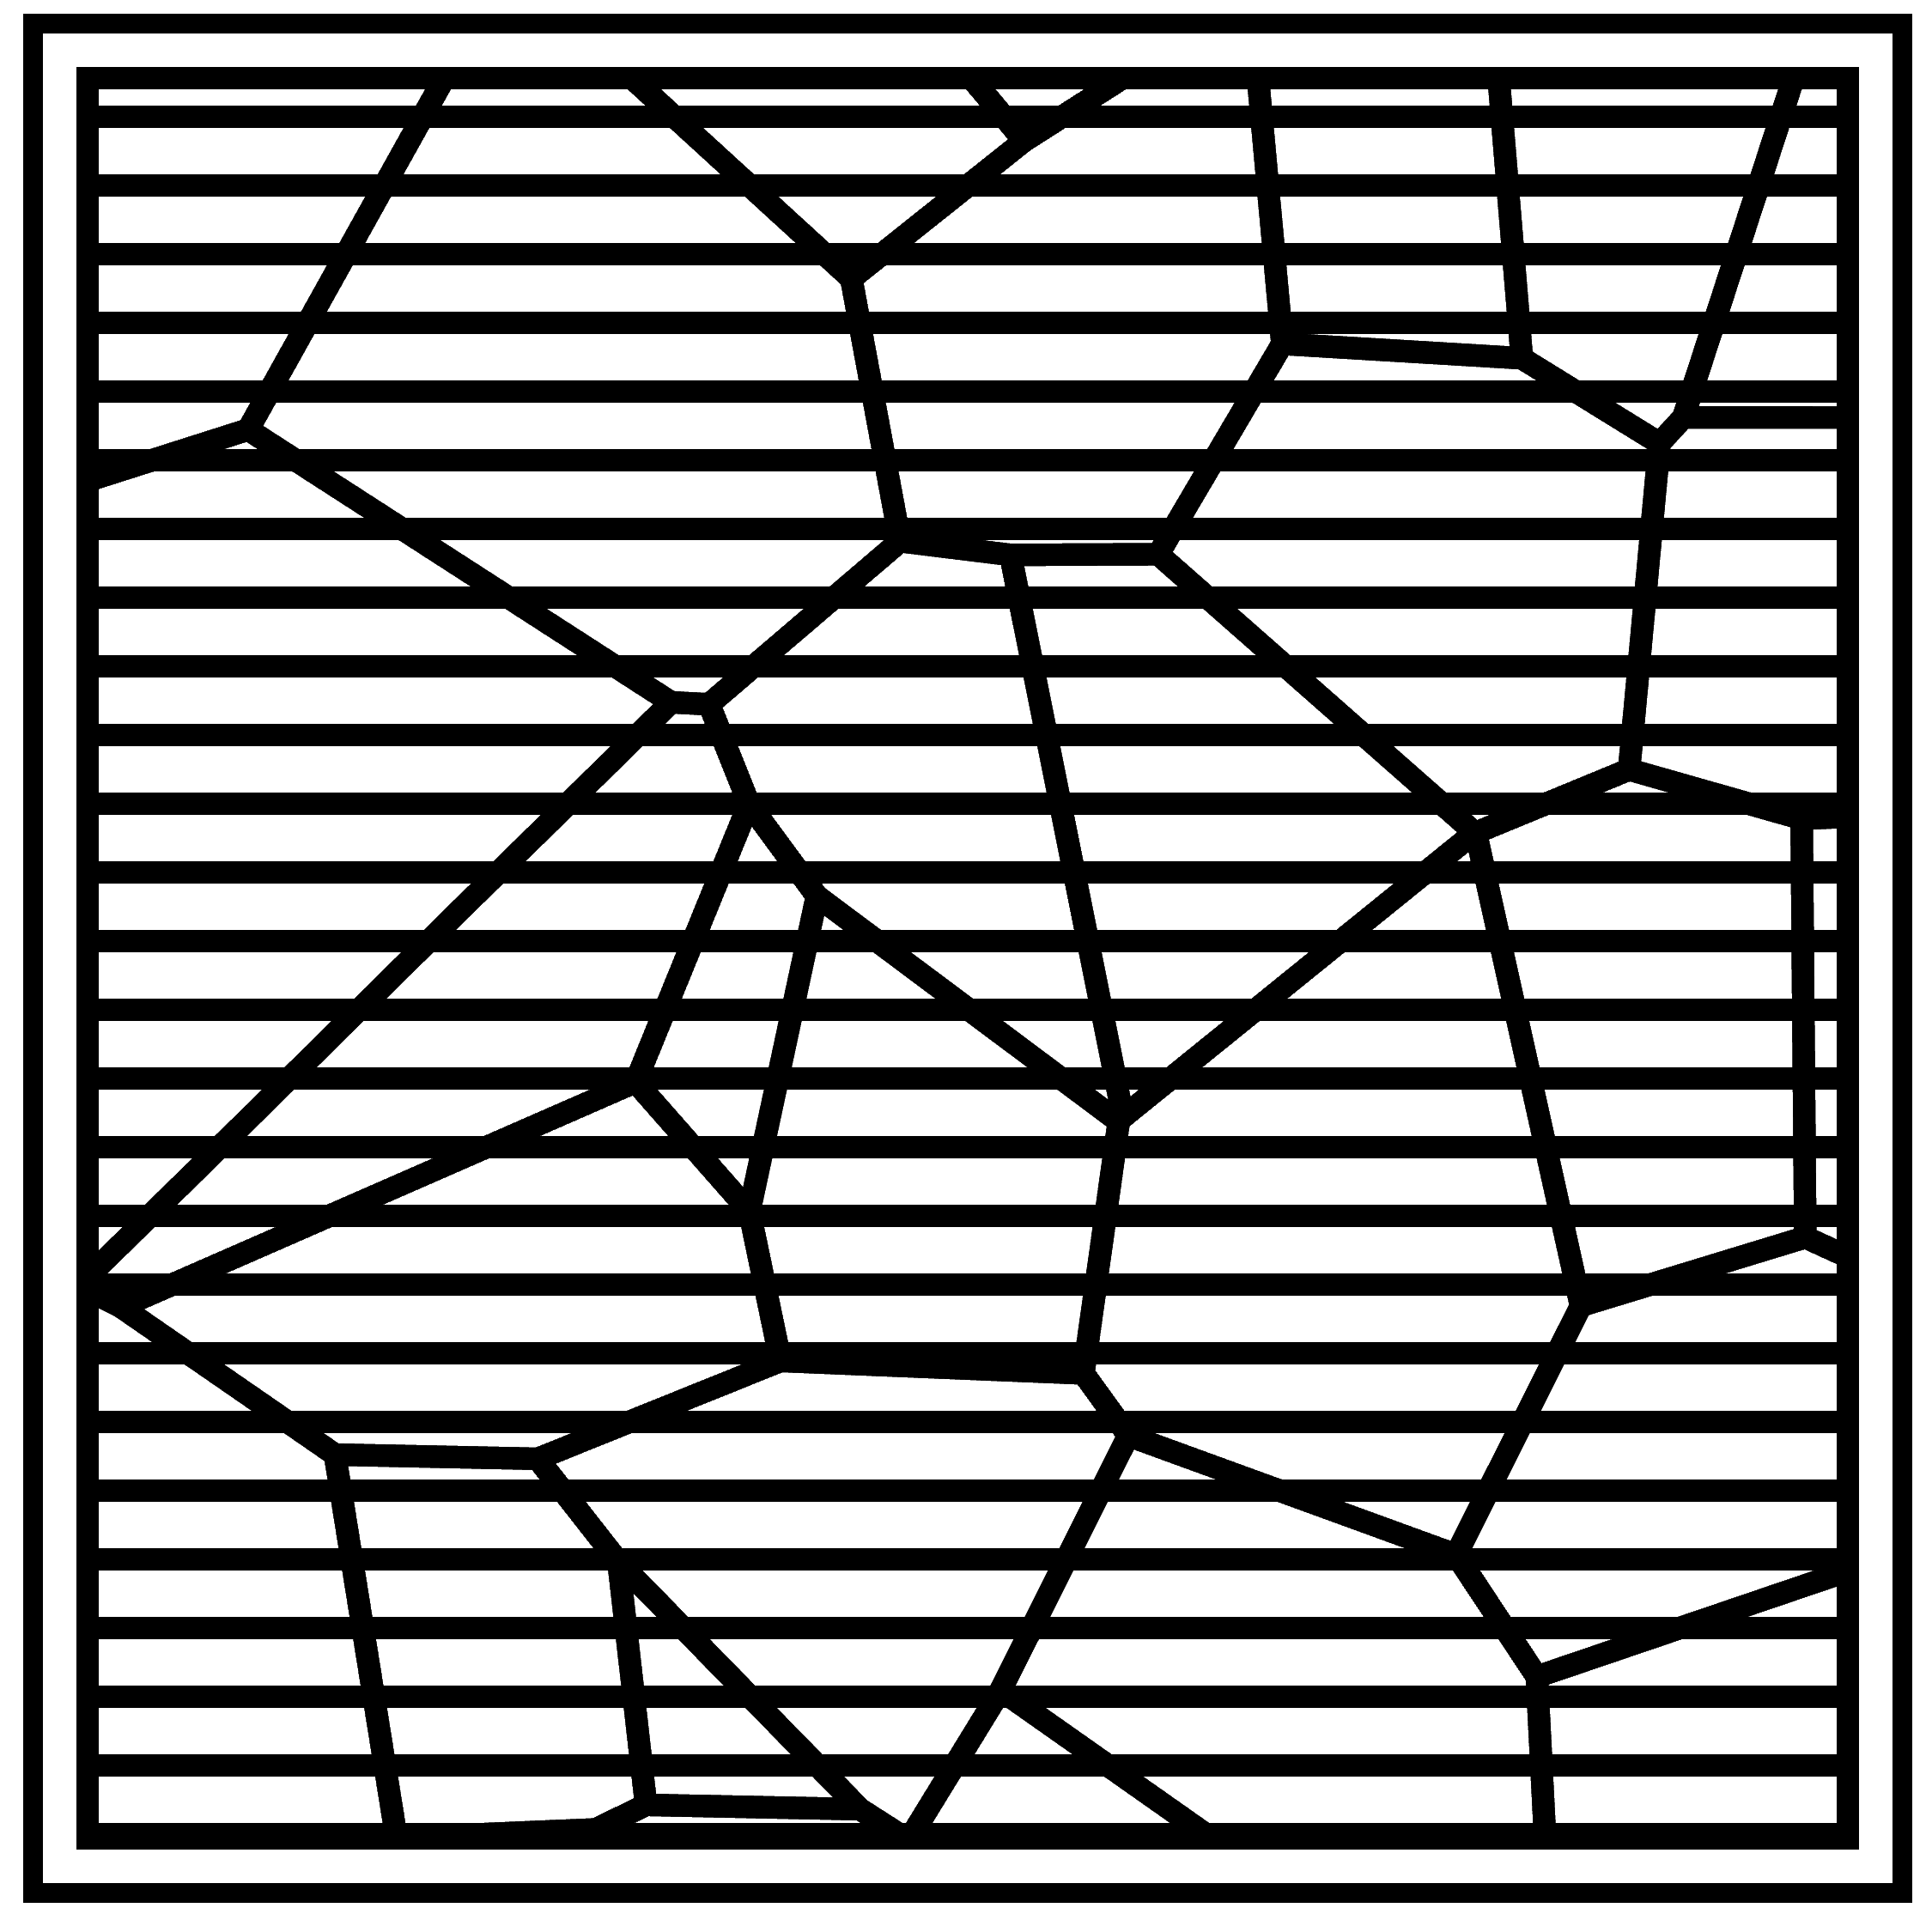
Et voilà!
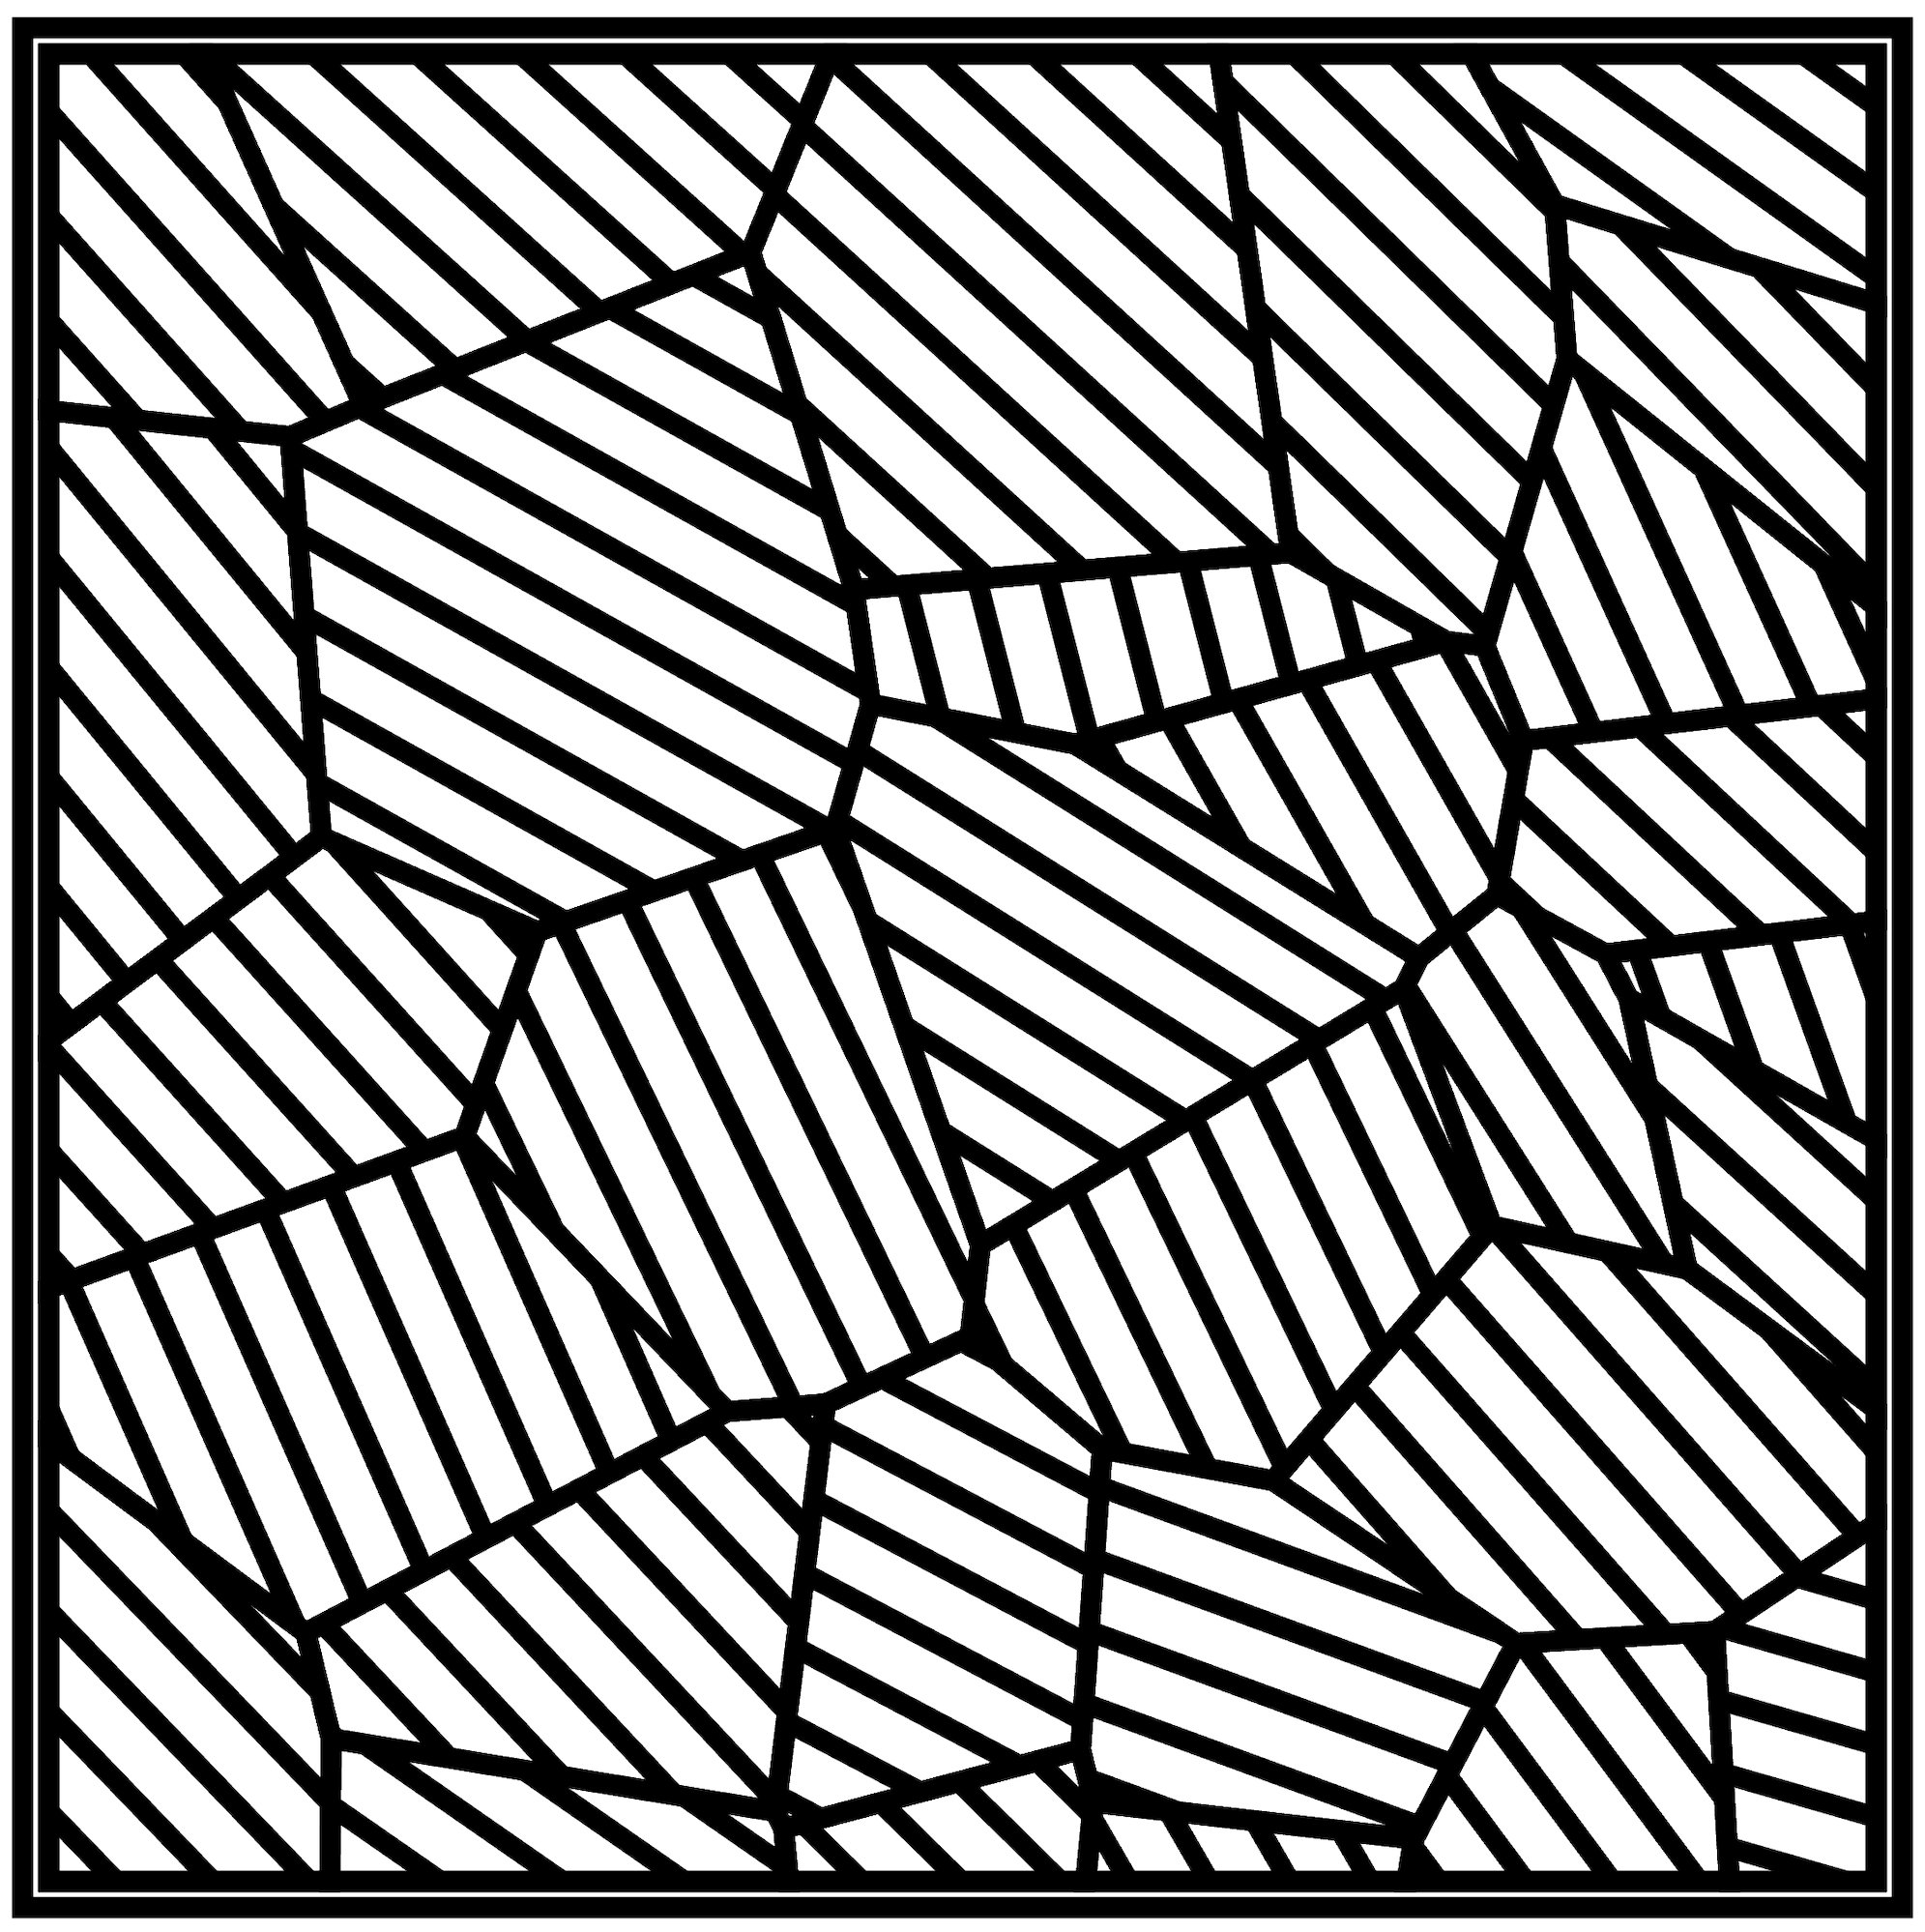
You can see a live version embedded down below. If you're on mobile, sorry it's best viewed on a desktop at https://polylines.bulkan.dev
If you're interested the code is here
bulkanAfter three years from initial idea I was able to finally implement this sketch. There are still a few things in this implementation that I would like to work.
- If the angle to rotate the graphics instance with the lines is more than
90degrees then for some cells the lines start from the middle - Creating a new graphics instance for each polygon isn't ideal but it seems necessary because of
clip - Lastly, need to go back and work out the maths when using a diagonal scan line. Going back to principals of the equation for a straight line
y = mx + cand finding an intersection point of two lines when we only know thevertices(I believemwas missing in my calculations).
I will continue playing around with this sketch and see if I can come up with different ideas for more interesting artwork.